In the modern world of data, companies are constantly seeking more efficient ways to analyze and present their data. Data analytics plays a vital role in decision-making processes across industries, allowing businesses to make informed choices that drive growth and innovation. As of 2024, the global business intelligence market size is expected to grow from $27.6 billion in 2020 to $45.2 billion by 2025, a growth rate of 10.4% annually. This growth is being largely driven by the rise in adoption of Power BI Analytics Services and similar business intelligence platforms.
Microsoft’s Power BI has emerged as one of the leading tools for data analysis and reporting. It is a versatile business intelligence tool that provides robust Power BI Data Analytics Services for organizations of all sizes. With its easy-to-use interface, powerful analytical capabilities, and seamless integration with other Microsoft products, Power BI has become a cornerstone for data analysis. This article explores how Power BI simplifies data analytics and reporting, providing businesses with actionable insights.
What is Power BI?
Power BI is a suite of business analytics tools designed to help businesses visualize and share insights from their data. With Power BI, companies can connect to hundreds of data sources, transform raw data into informative visual reports, and share these reports with stakeholders in real-time. The platform is built to cater to users at all levels, from beginners to advanced professionals, offering intuitive features that make data analysis accessible.
The Importance of Data Analytics in Today’s Business Environment
The importance of data analytics in business cannot be overstated. In today’s competitive environment, businesses that leverage data analytics have a significant advantage over their competitors. According to a 2023 study by McKinsey & Company, businesses that utilize data-driven decision-making are 5 times more likely to make faster decisions than their competitors.
From identifying new opportunities to optimizing processes, data analytics drives business decisions and improves operational efficiency. Power BI has emerged as a powerful tool in enabling businesses to tap into the full potential of their data.
How Power BI Transforms Data Analytics

Power BI simplifies data analytics by offering several key features that make it easier for organizations to analyze and report on their data.
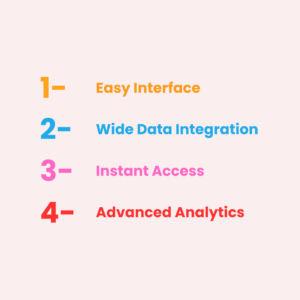
1. Intuitive Interface
One of the primary reasons Power BI has become so popular is its intuitive interface. Even users without a background in data analytics can quickly learn to navigate the tool. The drag-and-drop functionality makes it easy to create interactive visualizations such as bar charts, line graphs, and pie charts, among others.
2. Comprehensive Data Connectivity
Power BI integrates with a vast array of data sources, including Excel, SQL Server, Google Analytics, and cloud services like Azure and Salesforce. This connectivity allows businesses to bring data from different systems together into one cohesive report. The ability to pull data from multiple sources simplifies the process of analysis, providing a comprehensive view of the business.
3. Real-Time Data Access
With Power BI, users can access real-time data, which is essential for timely decision-making. Reports and dashboards update in real-time, providing users with the most up-to-date insights available. This functionality is crucial for businesses in fast-paced industries where decisions need to be made quickly.
4. Advanced Analytics Capabilities
Power BI’s advanced analytics features, such as predictive analytics and natural language querying, allow users to derive deeper insights from their data. Predictive analytics enables businesses to forecast trends based on historical data, while natural language querying lets users ask questions in plain English and get instant answers.
Benefits of Power BI Analytics Services
When businesses implement Power BI Analytics Services, they unlock numerous advantages that help them gain a competitive edge.
1. Improved Decision-Making
With access to visualized and analyzed data, decision-makers can make more informed choices. Power BI provides data-driven insights that help business leaders identify trends, spot opportunities, and reduce risks. For example, retailers can use Power BI to analyze customer purchasing patterns and make data-driven decisions on inventory management and marketing strategies.
2. Increased Collaboration
Power BI allows teams to collaborate more effectively by sharing reports and dashboards. This collaborative aspect is essential for ensuring that all stakeholders are aligned on business objectives and strategies. The sharing feature enables users to access reports from any device, promoting flexibility and collaboration within teams.
3. Time-Saving Automation
Power BI automates the process of generating reports, which can be time-consuming if done manually. With automated reporting, businesses can save time and ensure consistency across reports. Automation also ensures that reports are updated regularly, without the need for manual intervention.
4. Cost-Effective Solution
Power BI offers an affordable solution for data analysis, especially when compared to traditional business intelligence tools. Power BI’s pricing model is scalable, which means businesses can choose a plan that suits their needs and budget. Additionally, the platform’s ease of use reduces the need for specialized expertise, further cutting down costs.
The Role of Power BI Data Analytics Services in Reporting
Reporting is an essential aspect of business operations. Power BI simplifies the reporting process by allowing users to generate customizable reports that can be tailored to meet specific business needs.
1. Customizable Dashboards
Power BI allows businesses to create custom dashboards that highlight the key metrics they need to track. Whether it’s sales performance, financial health, or customer satisfaction, Power BI dashboards can be tailored to display the most relevant data. Users can also set up alerts to be notified when specific metrics hit a threshold, enabling quick action when necessary.
2. Interactive Reports
Unlike traditional static reports, Power BI’s reports are interactive. Users can click on different elements of a report to drill down into more detailed data. This interactivity makes Power BI reports much more engaging and useful, as users can explore data at different levels of granularity.
3. Cloud-Based Sharing
Power BI’s cloud-based platform makes it easy to share reports and dashboards with team members and stakeholders. This feature enables businesses to keep everyone in the loop, whether they are in the office or working remotely. Cloud-based sharing also ensures that everyone has access to the latest reports, eliminating the need to email reports manually.
Real-World Examples of Power BI in Action
Power BI is used by a wide range of industries to streamline data analytics and reporting. Below are some real-world examples of how businesses leverage Power BI:
1. Retail Industry
Retailers use Power BI to track sales performance, inventory levels, and customer behavior. For example, a retail chain can analyze sales data from different locations and identify which products are performing well and which are not. With this data, they can make informed decisions on inventory management, marketing strategies, and store promotions.
2. Healthcare Sector
In the healthcare sector, Power BI is used to monitor patient outcomes, staff performance, and resource utilization. Hospitals and clinics use Power BI to analyze patient data and improve healthcare delivery. By tracking patient trends, healthcare providers can optimize operations and improve patient care.
3. Manufacturing Industry
Manufacturers use Power BI to monitor production lines, track supply chain efficiency, and manage inventory levels. Power BI analytics help identify inefficiencies in the manufacturing process and highlight areas for improvement. With real-time insights, manufacturers can reduce downtime, optimize resource usage, and improve overall productivity.
Also Read: 10 Common Mistakes to Avoid When Designing Power BI Dashboards
Power BI vs Other Analytics Tools
While Power BI is a popular choice for data analytics, it’s essential to compare it with other analytics tools to understand its unique advantages.
1. Power BI vs Tableau
Tableau is another leading data visualization tool. While both Power BI and Tableau offer similar functionalities, Power BI is more affordable and easier to use for beginners. Tableau, on the other hand, is better suited for more advanced users and offers more customization options. Power BI’s integration with other Microsoft tools, such as Excel and Azure, gives it an edge for businesses already using these platforms.
2. Power BI vs Google Data Studio
Google Data Studio is a free data visualization tool that provides basic reporting functionalities. While it’s a good option for businesses with simple data reporting needs, Power BI offers more advanced features, such as predictive analytics, real-time reporting, and a wider range of data connectivity options.
The Future of Power BI and Data Analytics
As technology continues to evolve, so too will Power BI and data analytics. In the coming years, we can expect to see further advancements in artificial intelligence (AI) and machine learning (ML) capabilities, which will enhance Power BI’s ability to provide even more powerful insights. The rise of automated analytics will also make data-driven decision-making even more accessible for businesses of all sizes.
Conclusion
In conclusion, Power BI is an invaluable tool for businesses seeking to simplify their data analytics and reporting processes. With its user-friendly interface, powerful analytical capabilities, and seamless integration with other Microsoft tools, Power BI helps businesses of all sizes turn data into actionable insights. Whether you are looking to improve decision-making, increase collaboration, or save time with automated reporting, Power BI Analytics Services offer a cost-effective solution to meet your needs. By utilizing Power BI Data Analytics Services, businesses can enhance their operations, gain a competitive edge, and stay ahead in today’s data-driven world.
Casey Morgan is a Digital Marketing Manager with over 10 years of experience in developing and executing effective marketing strategies, managing online campaigns, and driving brand growth. she has successfully led marketing teams, implemented innovative digital solutions, and enhanced customer engagement across various platforms.


